
Digital tracking can transform how we trace timber through the value chain. The DigForeTrace project explored the feasibility of tracking individual logs from the growing site to the processing plant.
Digital Traceability-In Swedish forestry, it has long been possible to track the flow of products from the forest to industry at the level of individual harvesting sites. Logs from these sites are organized into stacks, which are marked with stamps or labels. From these timber stacks, the logs are transported to the industry where they are processed. This system works well for managing product types but does not track individual logs. For example, pine logs are sorted into a specific pine log stack and then sent to a sawmill, while coniferous pulpwood is directed to a softwood pulp stack for delivery to a pulp mill. This method allows products to be traced back to their original sites, but the question remains: is it possible to trace these products all the way back to their original growing place? The DigForeTrace project explored this possibility, among other aspects.

-
The WeighPro Wireless Weighing Link represents a precise and dependable weighing system designed specifically for round timber, eliminating the need for re-calibration. This system offers operators minimal maintenance requirements, boasting an impressive battery life of up to two years between recharges.
-
That’s a remarkable amount of work hours for a single machine, the Norcar 600 owned by Erkki Rinne is taken well care of, it even has the original Diesel engine.
-
It is not possible to eliminate chain shot, but there are simple steps that can be taken to reduce the risk.
-
Arwel takes great pride in the fact that the mill has no waste whatsoever, “the peelings are used for children’s playgrounds, gardens and for farm animals in barns in the winter and the sawdust has multiple uses in gardens and farms as well.
-
Timber hauliers need to encourage young blood in, and also look after the hauliers we have, we need make the sector a safe and positive place to work.
FIND US ON
Related Posts
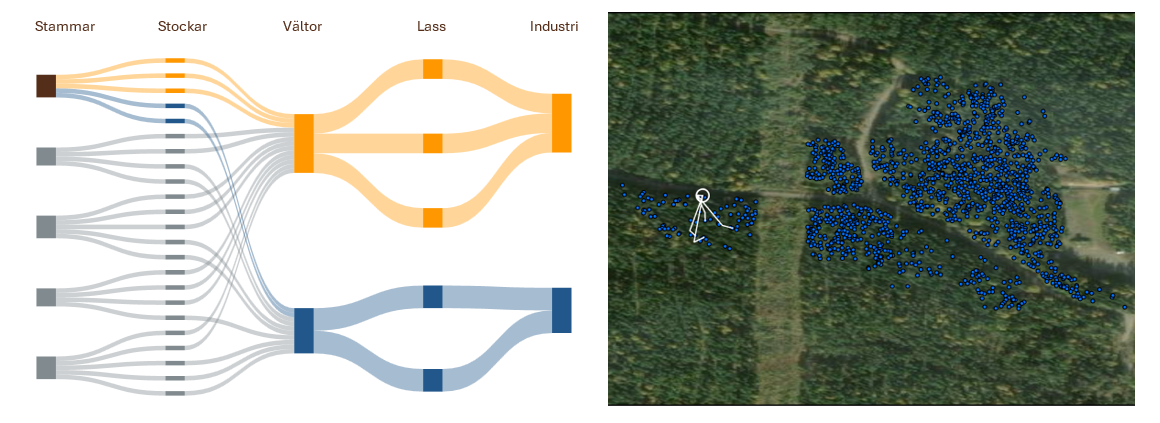
Figure 1. Schematic flow of products from forest to industry to the left. Proposal for individual tracking of logs to the growing site to the right.
Traceability in the forest
Digital tracking can be done in many different ways. From industry, experiments have been made with different types of markings such as RFID tags or code markings, as well as by reading growth rings with optical systems, to name a few. Common to these is that they link traceability directly to individual logs, which creates the potential for high accuracy, but it requires extra work or installation of additional technical systems in different parts of the production chain to work. In this project, the tracking was focused on what is possible to achieve through passive use of systems and information that are already available, at least in a modern production fleet. The tracking was done by following individual logs as far out from the growing site as possible, after which harvester measurements of log properties were matched with industrial measurements in as limited a sample as possible.
An interconnected chain
In order to be able to trace products back to the trees’ growing places, there must at some point have been information about where each tree, from which each log has been cut, has grown. Modern harvesters measure the length, diameter and volume of each log handled with high accuracy. Harvester data also indicates characteristics such as tree species and product type. The most modern harvesters also indicate with high precision coordinates for where each felled tree has grown and where each cut log has ended up. In other words, it is possible to see in a modern harvester’s data file where all the processed trees have grown. However, in the absence of additional systems, a problem arises here. From the time the harvester cuts the log and it lands on the ground, there is no longer any physical connection between the precise measurements and the physical product. To bridge this, the project used a prototype of a log transport system. This is a system that shares data between a harvester and a forwarder, and thus enables the digital information for a specific log to be linked to a physical location in the forest. When a forwarder picks up a log of a certain product type from a location, the information is recorded in the forwarder’s data file. In this way, the forwarder can keep track of which logs it picks up with identities that can be matched to the harvester’s identities. The result is that the forwarder no longer only drives anonymous logs of a certain product type to a stack, but specific logs with known measured properties. In this modern flow, the forwarder also indicates a location for each timber stack and where in the stack each grapple is unloaded.
In the next step, logs are then loaded from a roller onto a truck for further transport to industry. Since the location of the roller is known, it is possible to match the location of the roller through a GNSS receiver in the truck and thus register which roller it has been loaded from.
When the logs finally reach their destination together with information about which roller they came from, the industry’s measurement of the logs can be matched against the known selection of logs that were in the roller where they were loaded. The result is that for each log measured at the industry, a number of suggestions for possible hits can be generated. These proposals consist of the logs whose measurements fall within the tolerances specified for the different measurements used in the matching.
How should the results be interpreted?
A traceability system of this type is based on a balance between two aspects.
- How often a correct log is found among the suggestions that the match generates.
- How many suggestions there are for each match.

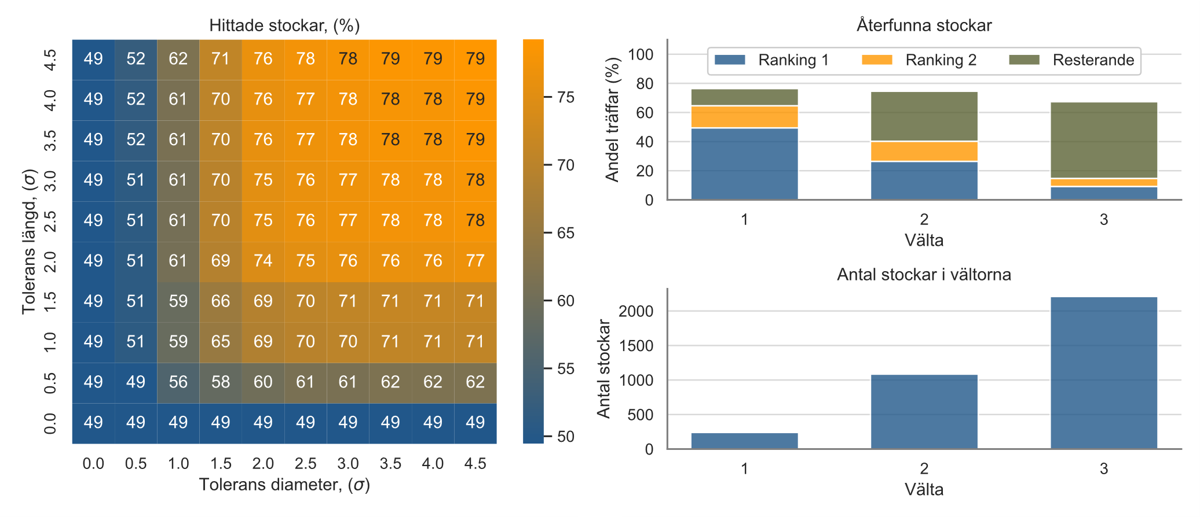
Figure 2. Example of the relationship between set tolerances and found logs, left. Number of logs recovered per roller and the total number of logs in each roller, to the right.
The results can only be interpreted with this in mind. Large tolerances in the matching lead to a large proportion of logs being found, but it will also give rise to many incorrect suggestions for each log and vice versa. An additional aspect is that the proportion of logs that a measurement is matched against affects the number of potential matches for that log, where a large basic selection leads to more suggestions. However, the percentage of correct matches found is not affected by the size of the basic sample. If a measurement is within the set tolerances, it will do so even if the proportion of other logs increases or decreases. The potential that exists to improve both matching and reduce the number of proposals is to keep the basic sample as small as possible and to work with measurements that are as precise as possible.
How well does this work?
For the calculation of results, tolerances were chosen that reflect a mean between the number of suggestions and the estimated accuracy. For three different rollers, harvester measurements were matched with industrial measurements for the length, diameter and taper of the logs. See the results in Table 1.
In the table, the “basic sample” indicates how many logs were in each specified roller and thus also how many logs each measurement was matched against. “Correct match” indicates how often the correct log was found in the list of suggestions provided for each match. “Matches per log” shows the number of suggestions that were generated on average for each match. Finally, “correct best match” shows the accuracy that could be achieved if only one log was selected as a suggestion.
Table 1. Results of tracking from three rollers of varying sizes.
| Roll over | Basic selection | Correct Match | Matches/stock | Correct best match |
| 1 | 240 pcs. | 76,4 % | 3.0 pcs. | 49,4 % |
| 2 | 1085 st. | 74,6 % | 11.8 pcs. | 26,4 % |
| 3 | 2210 st. | 67,4 % | 32.5 pcs. | 9,2 % |
Conclusions
Are the results good or bad? The sad answer is that it is up to the user of the results. What requirements should the results meet and what should the results be used for? If, for example, they are to be used for monitoring quality or evaluating properties linked to growing sites, this is a promising method. This is because the results provide a statistical overview of the analyzed products. In addition, all products matched will be physically similar as they have been matched and judged equally according to the tolerances set. However, in order to meet any regulatory requirements for individual tracking, with high demands on each individual log to be identifiable, the desired precision can be difficult to achieve.
Something to take away from this is that this type of tracking can basically be done passively with data that is already available in modern production systems and therefore does not need to involve any additional investments or additional work effort. From that perspective, the results are very good.
Source; Skogsforsk
Sign up for our free monthly newsletter here
Contact forestmachinemagazine@mail.com to get your products and services seen on the world’s largest professional forestry online news network.
#homeoflogging #writtenbyloggersforloggers #loggingallovertheworld
Written by loggers for loggers and dedicated solely to the equipment used in forestry operations.